Summary
Over a period of 66 years (1945 to 2011), CH2M HILL has grown from the group of 4 employees (a major professor and three former students) into a major, worldwide organization of 28,400 employees and $6.4 billion in annual revenues. This growth was driven: (1) By meeting certain growth prerequisites, (2) By having visionary, unselfish management, and (3) By staff retention and recognition. The compounded annual result (1945 to 2010) has been revenue growth of 21 percent, staff growth of 14 percent, with a 1966 to 2010 stock value appreciation of 19 percent.
Prerequisites for Growth
The CH2M HILL prerequisites were having:
- A desire to grow
- The policies that allowed growth
- The technical skills ability necessary to grow
- The financial ability necessary to grow
- Positive, external market conditions
Visionary, Unselfish Management
The visionary, unselfish management within CH2M HILL is best addressed by its version of a matrix project delivery approach and by its Board of Directors that developed and supported policies that met the growth prerequisites, the matrix system, and staff retention and recognition.
The Matrix System
Developed in 1971, CH2M HILL’s matrix system (organization) had one arm representing the various technical disciplines and another arm recognizing the need for a geographical presence through regional offices. This organization empowered the staff to complete any type of project, while providing access to all the Firm’s resources. Essentially, every employee wore two hats: one for technical expertise and the other for geographical location. This matrix allowed the Firm to maximize its technical capabilities on behalf of clients, moving the best experts to the location of the clients’ projects, while still maintaining a geographical presence in multiple locations.
Over the next two decades, under the matrix system, the firm grew from seven offices in the northwest to 23 across the U.S, and from 10 disciplines primarily focused on water and wastewater to over 44 addressing several new markets. We became, what some called, a battleship that was hard to steer in a changing competitive environment. To address this, the firm initiated a re-engineering effort in the early 1990s, that among other things, moved the firm from the internally-focused discipline system to the current externally-focused business line structure.
The Board of Directors
In 1966, the first Board of Directors consisted of six senior engineers, all of whom were full-time employees. Each Board member serves a 3-year staggered term. In 1978, the Board size increased to nine full-time employees to meet the growing needs of the Firm. To meet even greater national and international needs, outside directors were added. In 2010, the Board consisted to eight full-time employees and five outside directors.
Staff Retention and Recognition
In 1945, the Partnership of the founding fathers of CH2M, Cornell, Howland, Hayes, and Merryfield, all recognized the value of retention and recognition of key staff. By 1948, this Partnership had grown to include 12 partners.
This sharing of ownership continued when, in 1960, the Partnership began working ideas to allow more employees to share in the Firm’s profits. In 1965, the Partnership incorporated to allow development of a reward-sharing system similar to that of the Partnership, and thus the Key Employee (KE) program began in 1966.
KEs earned stock in CH2M Inc. through a KE bonus (KEB). In 1966, a KEB was paid in stock, with sufficient cash to pay the income tax on the bonus. The stock was not liquid and could only be redeemed upon retirement via a 10-year loan, resignation, dismissal from the company, incapacity, or death. If the KE considered resigning to compete, the value of the stock was reduced by about half thus affecting a golden handcuffs provision. In addition, a limit of no more than 25 percent of the Firm’s employees could be KEs; and, an individual KE was limited to a maximum amount of stock he/she could own. In 1977, an Employee Stock Option Program (ESOP) was added to help bridge the gap between KEs and those who felt they were qualified to be KEs. By the end of the KE Program in 1999, more than 1,000 employees were KEs.
Near the end of the 1990s, the Firm had grown to more than 9,000 employees. The KEs felt that their stock had little value, other than as a retirement vehicle, as the stock could not be liquid. At the same time, the Firm needed more capital to continue to grow, to compete for major projects, and to attract more qualified staff. In 1999, today’s privately operated program of full employee ownership began. In its first 5 years, and continuing today, this stock ownership program has established itself as an ownership industry benchmark, incentive compensation, and capital development program for both the individual and the Firm. Employee ownership has grown from 1 in 7 employees to 1 in 2.5 employees.
The Result: CH2M HILL Growth Rates
In the last 65 years (1945 to 2010), CH2M HILL has been growing at the rate of 12 to 25 percent compounded annually. Over this 65-year period, revenue has grown at the compounded rate of 20 percent, staff at the compounded rate of 12 percent, and stock price per share (1965 to 2010) at the compounded rate of 19 percent.
Introduction
Sixty-five years ago (1945-2010), a civil engineering professor and three of his former students launched a consulting firm with the goal (vision) of .. doing good, having fun, and making a profit. Today (2011), the vision of the founders has been realized in what is now a major engineering organization of over 28,400 employees with annual revenues of $6+billion … a growth that is unprecedented in the history of the engineering consulting industry.
The purpose of this vignette is to explore and, yes, speculate on the reasons that resulted in this outstanding success story. In the following, we will look at what we feel were the prerequisites for growth; the visionary, unselfish management structure and style; staff retention and recognition polices; and finally the documentation of the result: outstanding growth of revenue, staff, and share price.
Prerequisites for Growth
If one were to review business journals for successful growth factors, we would find a wide variety of opinions, some dealing with the company itself and others with the owner(s). For CH2M HILL the prerequisites for growth were:
- Desire to Grow
- Policies that Allowed Growth
- Technical Skill Ability Necessary to Grow
- Financial Ability Necessary to Grow
- Positive External Market Conditions
Visionary, Unselfish Management
Visionary, unselfish management within CH2M HILL from 1945 to date is best addressed by the Matrix System and the Board of Directors.
The Matrix System
Over the years, much has been written about the all important CH2M HILL version of the matrix system as it applied to CH2M HILL’s successes to date. In 1971, “The firm’s internal operating structure was redesigned to function under the matrix system of management, almost single-handedly designed by Archie Rice, which roughly created intersecting lines of Professional Services management and Regional Administration management.” Under this organization, a “Discipline Director” who bore responsibility for technical excellence headed each of the several technical disciplines. Discipline Directors reported to a Technology Director. The position of Technology Director and the various Regional Managers reported to the President who reported to the Board of Directors.
The purposes of this reorganization, as Archie Rice believed “….were necessary to the firm’s financial well being. CH2M’s new organization needed to empower the staff to complete any type of project, while providing accesses to all of the firm’s resources. Rice’s recommendation: Create a matrix organization with one arm representing the various technical disciplines and another arm recognizing need for a geographical presence through the regional offices. He felt that this configuration would most efficiently assure efficiency and uniformity of technical excellence in project execution.
As Rice envisioned it (and as it was put into practice), every employee would essentially wear two hats: one for technical expertise, and the other for geographical location. This matrix allowed the firm to maximize its technical capabilities on behalf of clients, moving the best experts to the location of the client’s projects, while still maintaining a geographical presence in multiple locations.”
The Board of Directors
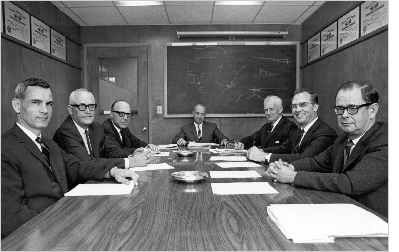
When CH2M ceased to be a partnership, it became necessary to elect a Board of Directors whose duty would be to oversee the operation of the company and elect officers as required by Federal Law. The first such Board of Directors (1966) consisted of six senior engineers, all of whom were full-time employees. Typically then, as now, directors were nominated and elected to serve 3-year terms unless different terms were required to stagger the terms.
In 1968 through 1973, the Board was expanded to seven, all full-time employees. In 1974, the Board formally elected a chairman. In 1978, the Board size was increased to nine, all full-time employees. In 1984, an outside director was added as the Board expanded to 10 members. A second outside director was added in 1985, which increased the Board size to 11 members. As of 2010, the Board consists of 13 persons of which 5 are outside directors.
Since the Board’s beginning in 1966, its decisions have had major impacts on the growth of CH2M HILL. From the employee ownership program and the matrix system to office expansions, acquisitions, and entrance into new markets, the Board (PDF) has had a key, visionary role.
Staff Retention and Recognition
Contributing the most to staff retention and recognition were first, the expansion of the CH2M partnership; second, the Key Employee Stock Ownership programs and ESOP programs; and finally, the current Full Employee Ownership and Incentive Compensation program.
Expansion of the Partnership
The founding fathers of CH2M, Holly Cornell, Jim Howland, Burke Hayes, and Fred Merryfield, early on recognized the value of retention and recognition of key staff. Between 1948 and 1964, the Partnership grew from 4 to 12 to attract and retain the best people available, to reward them for their contributions, and to give them incentives to succeed.

Key Employee and Employee Stock Ownership Program
This sharing of ownership continued when, in 1960, the partners began working on ideas to let more employees share in the profits of the firm. In October 1965, at a partners’ meeting, a motion passed unanimously to authorize the signing of formal Articles of Incorporation; and CH2M began doing business as a Corporation on January 1, 1966. A goal of the incorporation was to develop a reward-sharing system similar to that of the Partnership. Through the KE program bylaws, the intent of the ownership policy was to “define the policy of the corporation to maintain ownership of its stock by compatible persons actively contributing to the success of its operations.”
KEs earned stock in the organization through the KEB. Initiated in 1966, KEB was paid in stock, with cash sufficient to pay the income tax on the bonus. Stock was not “liquid” and could only be redeemed for cash upon retirement, resignation, dismissal from the company, incapacity, or death. If the KE considered resigning to compete, the value of the stock was reduced by about half thus affecting a golden handcuffs provision. In addition, a limit of no more than 25 percent of the firm’s employees was set; and, an individual KE was limited to a maximum amount of stock he/she could own. The KEB program was well received by those who were voted to participate in the program. However others, not included as KEs, often felt that they were also competent, loyal, and contributing employees.
To help bridge the differences (between the KEs and those who felt they were key employees), an Employee Stock Option Program (ESOP) was added in 1977. On an annual basis, the company made contributions in the form of stock to the ESOP on the behalf of all CH2M HILL employees.
The KE program remained in effect until the end of 1999. By that time the ranks of the KEs had swelled to more than one thousand. This successful 33-year program had been developed when there were only a couple hundred employees and the firm was still just CH2M.
Full Employee Ownership and Incentive Compensation Program
Near the end of the 1990s, the firm had more than 9,000 staff and was now CH2M HILL, a major player on a worldwide scale. However, few KE employees knew the current stock price or how the price was calculated and ownership of the stock simply had no meaning to them because they could not buy or sell it until they retired or left the firm. For most KEs, the prospects of retirement were far enough away that the stock value had little relevance, aside from the golden handcuffs consideration.
It was also a time when CH2M HILL was also experiencing the strains of growing capital requirements to compete for major projects. In addition, there was pressure to develop and attract the best and brightest from a shrinking pool of qualified science and engineering graduates. At the same time, many KE shareholders were disenchanted with the lack of liquidity of their CH2M HILL stock and its relatively feeble performance compared to skyrocketing stock prices in the broader public market.
To address these issues, the Board of Directors assigned a special task force in May 1998 to investigate the firm’s ownership and incentive compensation program. The task force proposed a program that would expand ownership opportunities to all staff, tie compensation incentives more directly to performance, and establish greater liquidity of stock for shareholders. The program was rolled out in 1999.
In its first 5 years, the ownership program established itself as a benchmark ownership, incentive compensation, and financial-growth program for both the company and for individual employee owners. By the last trading quarter of 2005, CH2M HILL’s stock price had nearly quadrupled from its established value of $4.31 a share (before the program was launched) to $16.73. Employee participation in the ownership had grown from 1,000 KEs (one in seven employees) to more than 6,500 (one in 2.5 employees) direct shareholders.
While CH2M HILL stock performed well as an investment for shareholders, the leading beneficiary of the expanded ownership program was the CH2M HILL business enterprise itself. From a company with a net worth of $40 million at the inception of the expanded ownership program (begun in 2000), net worth climbed to nearly $320 million by year’s end in 2005. With this newly found financial strength, the company could invest in and compete for projects that were previously out of reach, explore joint-venture and project partnerships, and maintain financial reserves for future strategic investment (e.g., acquisitions).
CH2MHILL Stock Evaluation Approach
For the most part, CH2M HILL’s stock evaluation approach has remained the same since the beginning of the KE program. The most significant difference in the evaluation approach has been the time period of the past financial data to be included. Under the KE program, when the stock price was evaluated once a year, the past 5 years were included. Under the full ownership program, where the stock is re-evaluated every quarter, the past four quarters are used.
The following describes the “official” stock evaluation approach (PDF) under the current program.
The Result: CH2M HILL Growth Rates(1)
Overview
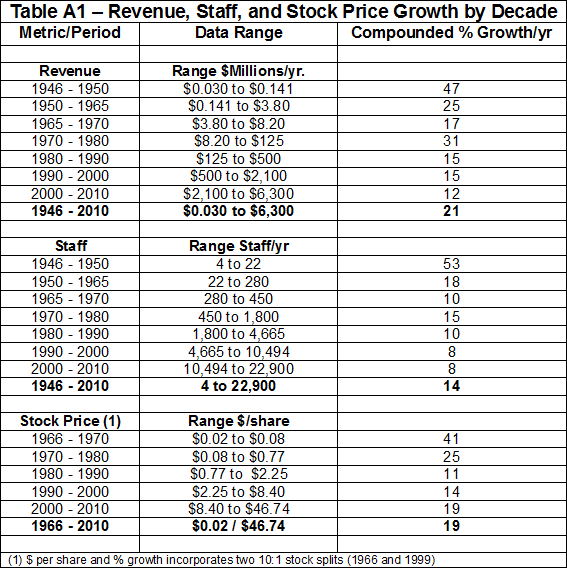
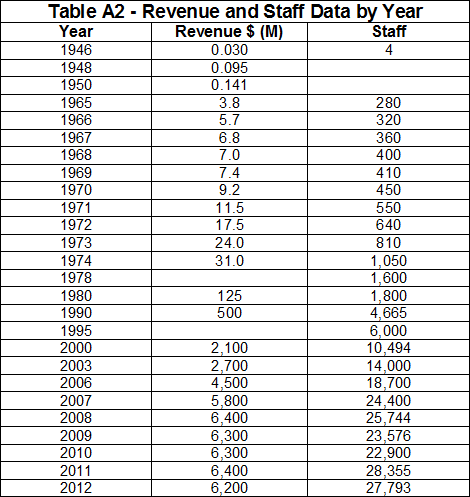
The purpose of this section is to present and discuss collected data that reflect the growth of CH2M HILL. The data came primarily from the Alumni History Web site and personal records. Total revenue, staff size, and stock price have been chosen to measure this growth. Data for total revenue and staff size span the period of 1945 through 2012. Stock price data begin with the incorporation of CH2M in 1965 and end with the second quarter of 2012. The data are presented in Table A1 – Revenue, Staff, and Stock Price Growth by Decade, presented in Appendix A.
In the last 65 years (1945-2010), CH2M HILL staff and revenue grew at an astounding rate of 14 to 21 percent a year, respectively, compounded as reflected in Table A1. CH2M HILL stock, over a period of 46 plus reporting years and quarters, has grown at the compounded rate of 19 percent per year. This stock growth compares favorably to Warren Buffett’s Berkshire Hathaway, the world’s most successful investor, which has grown at 20.2 percent from 1965 to 2010. The overall stock market, as measured by the S&P 500, increased by only 10 percent over the same period.
“Both revenue and stock price [growth] rates [Table A1 in the Appendix] have inflation imbedded in them, which has varied over the years but generally has been about 3 percent over any long period. Given a 3 percent inflation rate, the observed revenue growth of 21 percent yields a “real” revenue growth of 18 percent, 4 percent greater than the real observed staff growth rate of 14 percent over the same period. As the design/construct business grows proportionately faster, it is likely that the real revenue growth rate will continue to exceed the staff growth rate significantly.” (1)
1. The Alumni History Committee is deeply indebted to alumnus, Norm Brazelton, for much of the following thoughts, text, tables, and figures. While the tables and figures may not directly match actual CH2M HILL statistics, if they could be found, the text certainly represents the growth of CH2M and later CH2M HILL.
Total Revenue Growth
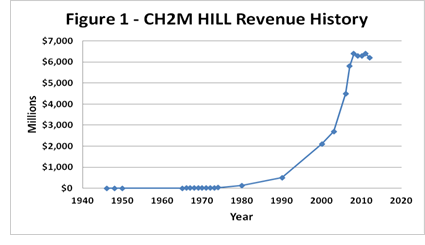
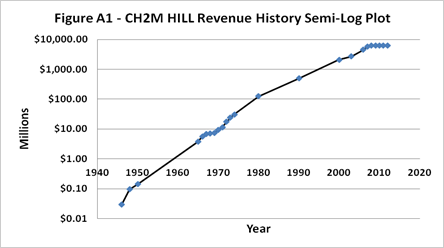
Figure 1 illustrates that the Total Revenue growth rate was an astounding 28 percent for the first 28 years (1946 to 1974) of the analysis and has been slowly declining since about 1980, but is still double digit. Percent declines with growth over time are a natural phenomenon as companies become larger. This type of growth is best represented by semi-log plots. The data are presented in Table A2 – Revenue and Staff Data by Year, and a semi-log plot is presented in Figure A1, both in Appendix A. The revenue data do not reflect the Halcrow acquisition.
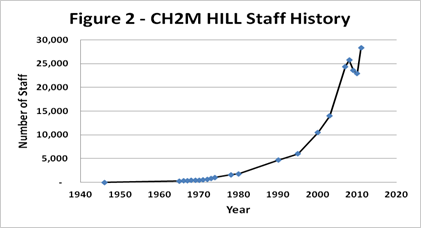
Staff Growth
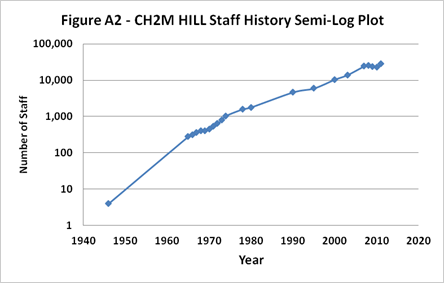
Staff growth rates are probably one of the best single indicator of growth of a professional firm like CH2M HILL, and the percentage rate of growth is generally more meaningful than the absolute numbers (Table A2). Figure 2 illustrates that the staff growth rate has also been slowly declining the last 20 years from double-digit rates for the first 40 years to about a still healthy 8 percent in recent decades. Jim Howland once said that, if the firm continued to grow at double-digit rates, it wouldn’t be too long before everyone in the country would be working for CH2MHILL! That would be a reach, of course; a healthy 8 percent still means doubling every 9 years! Wow, the firm likely could have 50,000 people by 2020 with revenues of $15 billion!
Again, the staff data are presented in Table A2; and the semi-log plot is presented in Figure A2 of Appendix A. This staff data do not reflect the Halcrow acquisition.
Stock Growth
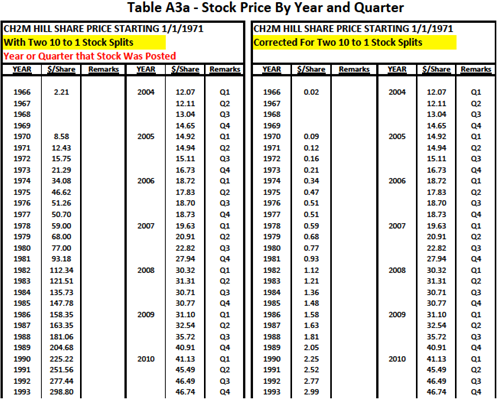
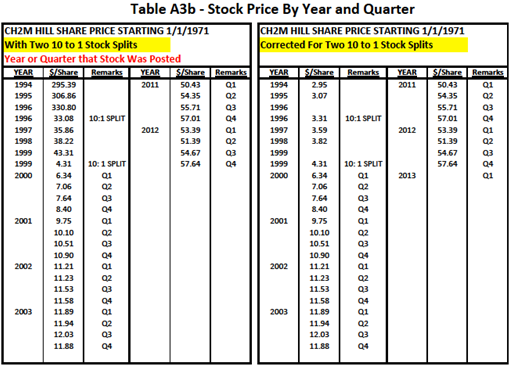
The firm (CH2M) was incorporated in 1965 with the first stock share price being reported in 1966. From 1966 through 1999, the stock price was reported annually the year following when the actual work, as reflected by the stock price per share, was accomplished. Two 10:1 stock splits took place, first in 1996, and then again in 1999. Since 2000, stock prices have been reported on a quarterly basis.

As with any stock, its price per share is affected by both internal bottom-line profits and external market conditions. Unique to CH2M HILL and other like companies is the observation that stock declines lag the general economy by 1 to 2 years because of booked, but not yet started work, and by ongoing work. Then, the recovery also lags any general economic recovery by about the same approximate 2 years. This is because newly developed and improved internal work delivery efficiencies take time to implement and external revised planning and funding periods by clients must take place and often before consultant-driven detailed engineering planning, design, and a construction can take place.

It is also important to note that with any stock price change caused by stock splits, different analytical techniques are required depending upon how the data are being used. Figure 3 reflects an industry standard for stock splits where the stock price is first calculated at the original undiluted rate and then is recalculated at the new stock split rate. For example, in 1996, the first undiluted rate was $330/share. After that 10:1 stock split, 10 times the number of shares were added to each stock holder’s account; and the price per share became $33.00/share. A similar split took place in 1999 when the share price changed from $43.31/share to $4.331/share.
In 1966, the initial actual stock per share was $2.21/share. For comparative purposes only, after two 10:1 stock splits (1996 and 1999), the initial stock value needed to be reduced by 100 times (10 times 10 = two stock splits) to an artificial value of just $0.02/share to make valid comparisons between years of stock value change. Figure 4 illustrates the result of this comparison. The data for these comparisons are presented in Tables A3a and A3b – Stock Price by Year and Quarter, in Appendix A.

Figure 5 is another comparison of CH2M HILL stock values per share. This final comparison was included in the CH2M HILL 2012 Form 10-K “Notice of 2011 Annual Meeting of Share Holders.” The graph shows the total cumulative shareholder return on CH2M HILL’s common stock from December 31, 2006, until December 31, 2012, for CH2M HILL’s common stock, the companies in the Environmental Financial Consulting Group’s engineering/consulting industry stock index, and the Standard & Poor’s Composite—500 Stock Index. The graph assumes the investment of $100 in CH2M HILL common stock and in each of the indexes on December 31, 2006, and reinvestment of all dividends, if any. CH2M HILL does not currently anticipate paying any cash dividends on the common stock.
In summary, during the decade of the 1970s, the price of the stock increased at close to 25 percent per year, then lowered to about 13 percent a year for the next 20 years until the reorganization of ownership in 2000. At that point, the growth rate of the stock price shot back up again to 19 percent for the past 10 years. Sure beats a stick in the eye!
References
1. “A Gradualist’s Approach to Management” (PDF) by James C. Howland. Presented at the May 11-18, 1984. ASCE Spring Convention held in Atlanta, GA, and subsequently made part of the Journal of Management in Engineering, Vol.1, No. 3, July 1985.
2. “CH2M HILL, Building a Better World, Transformational Milestones.” Copyrighted 2010 CH2M HILL. All rights reserved. Published 2010.
Appendix
Figure A1 – CH2M HILL Revenue History Semi-Log Plot
Figure A2 – CH2M HILL Staff History Semi-Log Plot
Table A1 – Revenue, Staff, and Stock Price Growth by Decade
Table A2 – Revenue and Staff Data by Year
Table A3a and A3b – Stock Price by Year and Quarter